Communications of the ACM
Using 'Averages' While Thinking About Social Behavior? That's Probably Wrong!

Ed H. Chi - Google Research Scientist
I've been meaning to write this blog post for a while. It's one of my pet peeves about understanding distributions describing social behaviors online. I get annoyed whenever I read a headline like "The Average Facebook Post Lives 22 Hours And 51 Minutes." The key here is the word "average." This is quite likely the wrong way to think about social behavior. This is actually quite common in social behavior reporting that I see online. Take another example from Pew Research: "The average American has just over two discussion confidants (2.16) – that is, people with whom they discuss important matters. This is a modest, but significantly larger number than the average of 1.93 core ties reported when we asked this same question in 2008." [1] I am also guessing that the use of average here is probably wrong. Why?
Averages are often not a good descriptor for many of the things we want to measure in social systems, since many of the distributions we deal with are not normal (Gaussian) distributions. I'm simply making an observation that the above two distributions are probably not normal distributions. In the above examples, how could it have been improved? Well, use a different metric that relates to the idea of "half-life," or the median.
In describing human behavior, we often find a log-normal distribution instead, which means that the geometric mean is a better metric for "normal" (which for a log-normal distribution happens to equal to its median). Thus, assuming you believe the distribution underlying your behavior is log-normal, it is better to ask for the median (that is, ask for the geometric mean and geometric standard deviation), instead of asking for the arithmetic mean (aka the average) [2].
The below figure from Wikipedia gives a good illustration of the problem [2]. Many of our social system distributions look more like the one on the left. In this example, the median is near 1.0, while the mean is on the right of the median at 1.7-ish, demonstrating how the arithmetic mean is a poor descriptor of "normal" behavior.
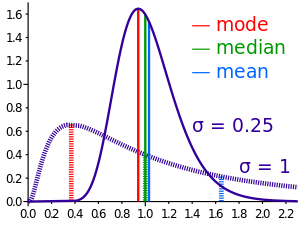
So why is the median better? Because intuitively it tells you that half of the people is above this point, and the other half below this point. It's interesting to note that the "mode" (defined as the highest point on the curve) is sometimes also used as a good descriptor for a log-normal distribution. By definition that the distribution is skewed, then we have mean > median > mode.
In particular, we know that frequency of posting activity, frequency of visits in many social systems are definitely not normally distributed, and the other metrics in social systems are likely to be similarly long-tailed. And it's worth pointing out that thinking about distributions should be part of many software design solutions, such as sorting reviews [3].
Real stat researchers will likely point out that many social system distributions are actually Pareto (or Power-law, or Zipf-distributed) [4] [5]. I won't bore you with the details of the differences [which are hard to explain here anyway], so see the below links for more information.
PS: BTW, sorry for the radio silence on social computing. I'm now at Google, and the transition took me away from blogging for awhile.
References
[1] http://www.pewinternet.org/Reports/2011/Technology-and-social-networks/Summary.aspx
[2] http://en.wikipedia.org/wiki/Log-normal_distribution
[3] http://www.evanmiller.org/how-not-to-sort-by-average-rating.html
[4] http://en.wikipedia.org/wiki/Pareto_distribution
[5] http://www.hpl.hp.com/research/idl/papers/ranking/ranking.html
Comments
Anonymous
Great post, Ed!
Here's a post by Evan Miller, "How Not to Sort By Average Rating," http://www.evanmiller.org/how-not-to-sort-by-average-rating.html, that might also be of interest to you and others.
Jack Rosenberger
Anonymous
Agreed! The log-normal is actually often a better fit than the power law distribution.
Also, logging outcomes means that small predicted changes (0.0x) in the logged variable are approximately 0.0x% changes on the original scale.
Ed Chi
Thanks for the contribution, Jack. The link you sent is reference [3] on my list, so I'm glad that great minds think alike, and apparently google for things alike as well.
Anonymous [who I think is Dean Eckles], makes a good point that log-normal distribution has certain properties that are often useful to know. One of them is that it is actually somewhat simple to reason about changes.
Anonymous
Medium? I think you mean median.
Ed Chi
Thanks for catching that. I clearly need a copy editor. I've fixed it in the source, and hope it will propagate soon.
Anonymous
Yes agreed. So expected behavior should not be assumed to be normal. We need to develop some sort of an analysis technique which would take distributions to be pareto normal.Instead of 1 mean there should be 2 means one for 80% of the observations and the other for 20% of the observations
Displaying all 6 comments