Communications of the ACM
A Multifaceted Perspective on the Interdisciplinarity of Data Science

Setting
Data science is an interdisciplinary field that integrates knowledge and practices from three perspectives: computer science, mathematics and statistics, and the application domain. See Figure 1

In the 2023 Spring semester, I taught three data science courses to three different learner populations with a variety of academic backgrounds, specifically in terms of their knowledge in each of the data science components. As I will show in this blog, this experience, of teaching similar content to students with different academic backgrounds, illuminated the varied facets of data science, revealing aspects that should be highlighted when teaching the subject in different situations as well as the fact that the interdisciplinarity of data science should be considered in problem-solving situations. Table 1 presents the teaching settings for each of these populations alongside references to my CACM blogs that describe them.
Table 1. The data science teaching frameworks studied
|
Course name |
||
Data Science for Senior Executives |
Research Methods for Graduate Students in Human Resource Management |
Workshop on People Analytics Applications |
|
Academic setting |
||
|
Division of Continuing Education and External Studies, Technion |
Department of Labor Studies, Faculty of Social Sciences, Tel Aviv Univeristy |
|
|
Students: Number and academic/professional background |
||
|
13 senior executives from a variety of Israeli organizations: Half work in the government sector and the other half in the for-profit sector |
59 masters students in human resources management
|
25 undergraduate 3rd year of 4th year computer science students |
|
Challenge |
||
|
Diverse application domains, ranging from nursing to energy and advertising; Learning to create and nourish a data culture |
Knowledge gaps in programing and algorithmic thinking |
Knowledge gaps in human resources topics |
|
CACM blogs |
||
|
The Interdisciplinarity of Data Science from the Perspective of the MERge Model (co-authored with Koby Mike) |
Teaching Data Science Research Methods to Human Resources Practitioners (co-authored with Dafna Gelbgiser): Part 1, Part 2, Part 3, Part 4 |
The Interdisciplinarity of Data Science from the People Analytics Perspective: Part 1, Part 2
|
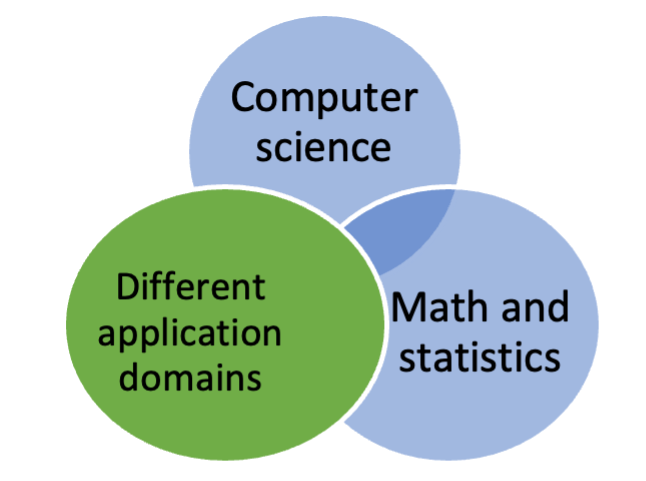
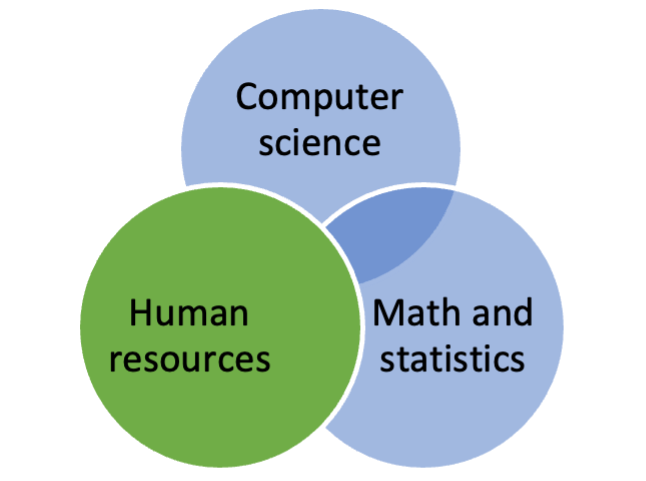
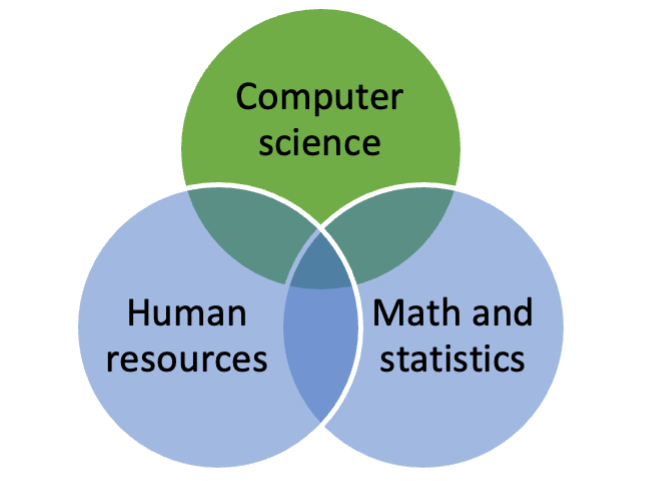
Figure 2 presents the Venn diagrams of data science in the three cases in which students' expertise is highlighted by green.
Data Science for Senior Executives |
Research Methods for Graduate Students in Human Resource Management |
Workshop on People Analytics Applications |
|
|
|
|
As can be seen, the three student populations were very different from the data science perspective. Later on in this blog, I will show how these differences are manifested in problem-solving situations related to data science.
Analysis and comparison of answers to data science problems by students with different academic backgrounds
Table 2 presents two questions and their solutions. The answers to these two questions, as given by the three groups of data science learners presented above, are analyzed in order to illustrate how differences in the academic background of the three groups are expressed in data science problem-solving situations.
Table 2: Two data-related questions and their solutions, used to illustrate differences in students' background and expertise
|
|
Lion Classification (Mike and Hazzan, 2022) |
Age of Death and Musical Genre (Bergstrom and West, 2021) |
|
Question formulation |
A machine learning algorithm was trained to detect photos of lions. The algorithm does not err when detecting photos of lions, but 5% of photos detected as lions are, in fact, of other animals (photos in which a lion does not appear). The algorithm was executed on a dataset with a lion-photo rate of 1:1000. If a photo was detected as a lion, what is the probability that it is indeed a photo of a lion? (a) About 95% (b) About 80% (c) About 50% (d) About 30% (e) About 5% (f) About 2% (g) Not enough data is provided to answer the question |
Researchers examined the average age of death of musicians according to the genre of music they play. It was found that while the average age of death for jazz musicians is 60, the average age of death for rap artists is 30. How can this phenomenon be explained? |
|
Solution |
Based on Bayes' Theorem, the correct answer is 2%. Explanation: Students are asked to evaluate the true positive rate of lion detection. The false positive rate, i.e. the probability that a given photo does not contain a lion even though it is detected as a lion photo, is given as 5%. Since the false negative rate (lion photos that are not detected) is given as 0, all lion photos will be detected. The question is, therefore, what will be the percentage of lion photos in the detected-as-lion-photos group. This percentage depends on the ratio of lion photos in the dataset, i.e. the base rate of lion photos, which according to the base-rate neglect bias, humans tend to ignore (Kahneman and Tversky, 1973). The base rate of lions is given as 1:1000, so based on Bayes' Theorem, the true positive rate is about 2%. |
Most rap and hip-hop stars are still alive today; we don't know how long they'll live. Moreover, since rap is a new genre, the only rap musicians who have died already are those who have died prematurely. Jazz has been around for a century or more and we have plenty of performers who have lived a full life. In other words, it is not that rap stars will likely die young; it is that the rap stars who have died, have certainly died young, because rap has not been around long enough for it to be otherwise (i.e. for them to grow old).
Source: Case study: Musicians and mortality (Bergstrom and West, 2021) |
Table 3 presents the distribution of answers to the Lion Classification question among the three populations. As can be seen, and not surprisingly, the percent of computer science students who answered the question correctly was the highest, and they did not exhibit the base-rate neglect cognitive bias at all (as reflected in the answer "95%"). On the other hand, the answers of the two other populations clearly demonstrate the base-rate neglect cognitive bias. In addition, the fact that the masters students in human resources management chose all possible options may indicate that, in addition to the base-rate neglect cognitive bias, about 25% of them simply guessed the answer due to gaps in their mathematical knowledge.
The answer distribution obtained can be explained by the fact that this question requires either some mathematical knowledge, the Bayse Theorem, or an intuitive understanding of the situation. Clearly, computer science students possess more advanced mathematical knowledge than the others.
Table 3: Distribution of answers to the Lion Classification question among the three learner populations
|
Answer |
Undergraduate senior computer science students (n=10) |
Masters students in human resources management (n=36) |
Senior executives from a variety of Israeli organizations (n=13) |
|
About 95% |
- |
50% |
38.5% |
|
About 80% |
- |
2.7% |
- |
|
About 50% |
- |
2.7% |
- |
|
About 30% |
- |
2.7% |
7.6% |
|
About 5% |
10% |
11.1% |
15.4% |
|
About 2% |
70% |
22.5% |
30.8% |
|
Not enough data is provided and the question can't be answered. |
20% |
8.3% |
7.7%
|
The analysis of the answers to the Age of Death and Musical Genre question paints an almost opposite picture to that obtained for the Lion Classification answers. Table 4 presents the answer distribution to this question among three categories, illustrated here by selected answers (PA – undergraduate computer science students who attended a workshop in people analytics; HR – masters students in human resources management; EM – executive managers):
- Research-based explanations:
- PA: It sounds to me like a classic case in which correlation doesn't mean causation.
- HR:
- The phenomenon cannot be explained using the presented data. There are many more variables that could have an effect other than the genre of music that the artists play.
- "[M]aybe the general average age of the rappers is lower and that of the Jazz musicians is higher, and so the distribution looks like that."
- Stereotype-based explanations
- PA: It's possible that people who choose to become rappers come from a different background than those who choose to become jazz musicians. Maybe a background of drugs and alcohol and the like.
- HR: I think that it's a phenomenon that has do to with culture. Rap culture comes from the street, from poverty and distress (this can be seen also in the protest song lyrics) – in these places you can find more crime, drugs, and violence. The Jazz culture is more relaxed and lighter. These factors can affect life expectancy.
- EM: Problematic lifestyle…
- "I don't know" answers (all given by HR students)
Table 4: Distribution of answers to the Age of Death and Musical Genre question among the three learner populations
|
Answer |
Undergraduate senior computer science students (n=10) |
Masters students in human resources management (n=39) |
Senior executives from a variety of Israeli organizations (n=12) |
|
"I don't know" |
- |
5 |
- |
|
Research-based explanations |
2 |
17 |
7 |
|
Stereotype-based explanation |
8 |
17 |
5 |
As Table 4 indicates, while the undergraduate computer science students and executive managers clearly exhibited the stereotype bias, its prevalence among the masters students in Human Resources Management was lower. This difference is not surprising since one of the main daily jobs of these master's students, i.e. recruitment processes, requires high awareness of the stereotype bias.
It should also be noted that only the masters students in Human Resources Management gave answers from the "I don't know" category. This may reflect the fact that, as masters students in Human Resources Management, they are aware of their knowledge gaps, while the other two groups felt obligated to give an answer even when they could only speculate about the answer.
Summary and conclusion
This blog illustrates how differences in the backgrounds of three groups of data science learners are expressed in their answers to questions related to data interpretation by the cognitive and social biases they either did or didn't exhibit. Specifically, we saw how computer science students did not exhibit the base-rate neglect cognitive bias, while human resource management students did not exhibit the stereotype bias. The answers of the group of executive managers represent a mixed group in terms of the biases they exhibited due to the managers' heterogenic backgrounds.
In general, the analysis presented in the blog reflects, once again, the multifaceted nature of the interdisciplinarity of data science, and consequently, the diverse populations that learn and use it, each from its own perspective. The analysis teaches us that the interdisciplinary of data science should be addressed differently when teaching data science to students with different disciplinary knowledge. Furthermore, it indicates that efforts should be invested, when possible, to form learning environments in which students from different backgrounds and from different study programs are encouraged to collaborate in data science problem-solving processes.
References
Bergstrom, C. T. and West, J. D. (2021). Calling Bullshit: The Art of Skepticism in a Data-Driven World, Random House.
Hazzan, O. and Mike, K. (2023). Guide to Teaching Data Science: An Interdisciplinary Approach, Springer. https://link.springer.com/book/10.1007/978-3-031-24758-3#toc.
Kahneman, D. and Tversky, A. (1973). On the psychology of prediction. Psychological Review 80(4), 237–251. https://doi.org/10.1037/h0034747
Mike, K. and Hazzan, O. (2022). The base-rate neglect cognitive bias in data science, Blog@CACM, Communications of the ACM.
Orit Hazzan is a professor at the Technion's Department of Education in Science and Technology. Her research focuses on computer science, software engineering, and data science education. For additional details, see https://orithazzan.net.technion.ac.il/.
No entries found


